How to Create and Leverage Infographics That Increase Traffic and Backlinks

Blogs and infographics are like peanut butter and jelly. There is no combo that works better.
But strangely enough, there are very few content and link experts focusing on the importance of infographics for those who depend on blog traffic for the majority of their virtual footfall.
And therefore, it just makes sense to start out with a series of strong justifications.
Why You Should Not Consider Your Complete Blog Content Strategy without Infographics:
Market Domination Media dove deep into the colorful world of visual content and found that blogs featuring infographics on a regular basis grew traffic 12% faster than the publishers who went with an all text approach. And this is because readers are about 30 times more likely to engage with an infographic than going through an article – no matter how well formatted and interesting the piece is.
These findings are well supported by influential sites like Mashable and Kissmetrics. If you refer to the post titled “How to Grow Your Blog to 100,000 Visits a Month Within 1.5 Years” by none other than Neil Patel, you will find his open admission that infographics can play a major role in getting you that elusive six figure traffic.
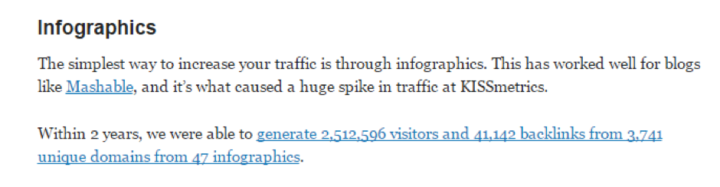
What is even more appealing about the statement is the use of the word “simplest”. Neil is someone who experiments with every conceivable white hat SEO and marketing strategy in the book. And when he tags something simple as well as effective, it is a good enough reason to replicate the tactic.
So why do infographics and blogs complement each other so well?
- First and foremost, visual content is processed about 60,000 times faster than text. People tend to remember 80% of the information they consume through infographics and this is in direct contrast to only 20% of the data that stays with them when they peruse an article. Think about it for a second. The sole purpose of a blog is to educate and inform the subscriber base. And this core motive is served extremely well by infographics. If you are serious about emerging as a niche authority, you should most definitely explore the coupling of blog content and infographics.
- Infographics are all about color and font variations. And they align with the concept of inserting a purposeful break in the flow of content for better retention. Placing an infographic to highlight an important (or complicated) message from the text portion of a blog is a sure fire way to drive home its significance.
- It has also been found that people who follow instructions supported by both texts as and illustrations are 323% more adept at picking them up and executing them than people who assimilate the knowledge from only text. This is a huge wake-up call for DIY bloggers. Unless you can add a hands-on video tutorial actually walking your readers through whatever you want them to learn, your best bet is a good old infographic.
- Last but not the least, visual content is shared about 40 times more frequently on social media. You can boost the popularity of your content if you supplement an interesting blog link description and a compelling call to action with an infographic. Forget about stock photos. They are passé. A custom infographic instantly puts the limelight on you and your message.
Let’s face it. Gamifying your blog or producing interactive quizzes and videos is not everybody’s cup of tea! And the financial investment is often considerable.
Whereas with infographics, you can do the majority of the prep work yourself by choosing an insightful topic and taking inspiration from the dozens of “best of infographics” compilations online to create a basic structure and style for your piece. With this taking care of, the actual rendition can be outsourced to someone on Fiverr or Upwork for as little as $30.
A 3 Point Checklist for a Viral Worthy Infographic:
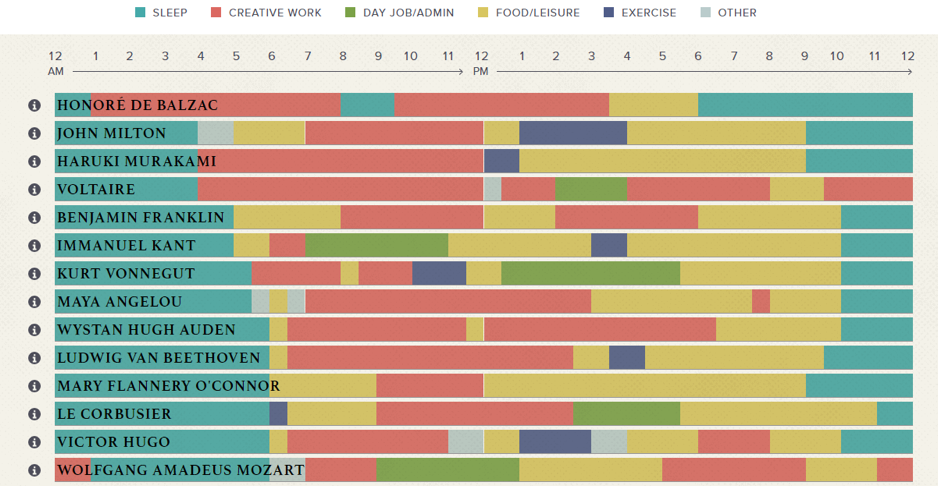
- Your infographic should most definitely be easy to take in. Many designers will advise you to “be creative” with your visual content. Creativity is great. Remember that before you are able to hook your readers with an infographic, you still have to contend with their ridiculously short attention span. If you try to impress them with your “out of the box” thinking and it doesn’t translate well, you have just lost plenty of traction. This infographic from Podio is a perfect example of information well presented. As you hover over each section of the bar, you can read the details pertaining to the activity of the famous personality.

- Your infographic MUST be on a topic that is of interest to your niche. This ties in with the research that you have to do prior to writing a blog. If the visual content you create is meant to add value to an existing text piece, then the infographic will be dedicated to a concept that the text focuses on. But if you want a stand-alone infographic that will be the hero for the content, then it is highly recommended that you:
- Search for the relevance and popularity of what you have in mind through Google Trends.
- Browse through the infographics that have been created for your niche and subject.
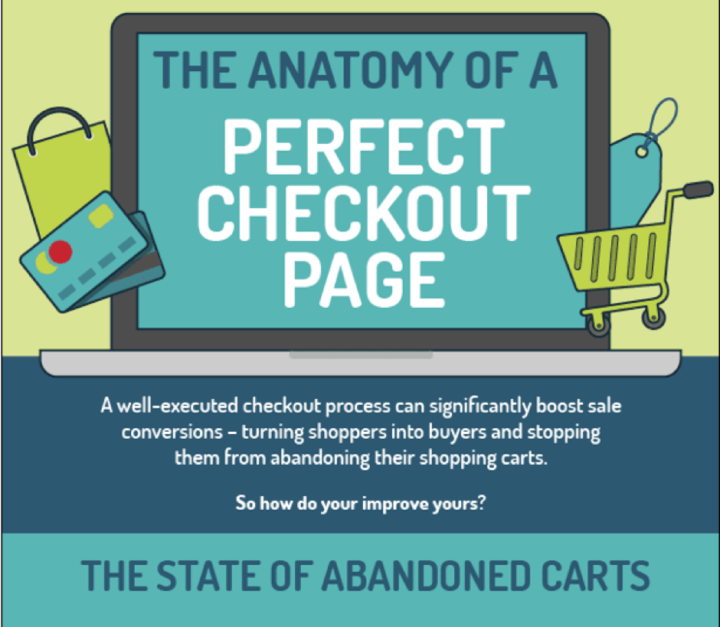
This will ensure an end result that is of actual value to your readers and you won’t end up repeating what has already been done. This infographic by VWO is a perfect example of solving a pain point. VWO as an A/B testing tool serves to increase conversion optimization awareness. The design is nothing to rave about but the information is spot-on and is bound to guarantee shares on social.
- Your infographic should simplify a process or a concept through its presentation. This is when the piece achieves true viral status. Lots of valuable details and top notch structures fall by the wayside if the infographic does not offer tangible takeaways for the consumer to act on. It is a simple matter of adding an “Action Item” after sharing best practices so that the suggestions can be put to good use. This infographic by Amberd Design Studio breaks down the complex considerations of a great logo into 5 rules that readers remember and even check their own logos again.
![]()
Four Ways in Which You Can Leverage Infographics to Turbocharge Your Blog Traffic & Back Links
1. Infographic Submission Sites & Directories: Article directory hey days are almost over. There are only a handful of high Domain Authority directories that can offer you any SEO benefit. But infographics are a whole different ball game.
- You can share infographics on multiple platforms without getting penalized by Google.
- The volume of infographics online is nowhere near as copious as text. This is a competitive advantage in and of itself.
This is why submission to quality infographic directories like Visual.ly, Fast Company & Daily Infographic proves to be a wise move. Google sees close to 41,000 exact match queries for infographics every month. This means more and more browsers are using search engines with the explicit intention of discovering impactful infographics. Having your piece up for display is bound to attract attention and then reel traffic back to your blog.
Pro Tip: When submitting your infographic, optimize the description and title with oft-searched keywords around your subject. This way you help Google tag your content relevant even if the search query does not include the word “infographic”. Also, do ensure that you have unique verbiage for every site that you submit the infographic too. This is a nod to Google’s appetite for “fresh” and “unduplicated”.
2. Influencer Marketing: Not many blog owners implement this strategy. And so it yields bonus points for the ones who take the time to do it right.
The first step in the process is to search for influencers in your niche. Who are the people fueling thought leadership in your industry/area of interest with books, strategies and even path-breaking courses?
The second thing to do is to find a way to marry their work with what you do. So let’s say you have a blog that talks about marketing. You can take Jeff Walker’s Product Launch Formula (PLF) and create an infographic around how the framework has revolutionized launches and how you incorporate it in your work.
Once the piece is ready, submit it to directories, but also reach out to Jeff Walker on Twitter and ask him to take a look at your handiwork. If he likes it, he will automatically share it with his network. Influencers need compelling content as well. Everybody does! And bam…you have primed traffic coming in from a reliable source.
Pro Tip: Make sure you brand your infographic with your blog URL so that no matter where it ends up, if it is interesting and informative, people can track it back to you.
3. Traffic from Social: Simple sharing of infographics on social is something everybody has tried once in a while. But with new options becoming available every day, why stick to the tried and tested.
- You can use infographics in ads to drive traffic to your blog. Simply add a portion of the infographic as your hero shot and put in a call to action to read the text. It will be a much better display of your expertise than going with stock images.
- You can also create a “Canvas” for your blog with infographics and links to the pieces that you feel are your very best work. A canvas allows you to add variety and dimension to the experience your social followers enjoy. If you do not know how to use or assemble a Canvas, here is the link to a simple guide.
Pro Tip: Savvy Facebook marketer? Turn that Canvas into an ad for exponential impact.
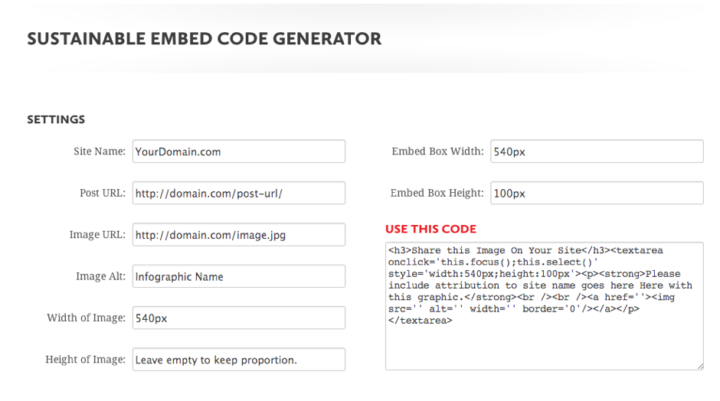
4. Backlinks with Infographics. There are two ways to go about this. The first is through embedding. If you follow up the infographic on your blog with an embed code, you allow people to re-publish the piece, earning you an automatic backlink because the embed code has your blog URL within it.
However, there is another, more valued way of gathering link juice with infographics. Backlinko founder Brian Dean lists details this approach in his blog. The gist of it revolves around:
- Creating a great infographic
- Finding high domain authority sites that might be interested in the piece
- Emailing them and bringing the infographic to their attention
- Allowing them to take it from there, use the infographic and attribute it to you. With a contextual backlink.
There is no limit to the ways in which you can use versatile infographics to your blog’s advantage. You might argue that the methods shared here apply to sites in general. But here is the thing – blogs must engage consistently and sustainably. They publish content every week (or month) and thus allow for the positive effect of infographic use to accrue over time for traffic and SERP boosts.